
Table of Contents
1. Demand forecasting for upstream value chain players
2. Industry dynamics and other factors that warrant more emphasis on sell-out forecasts
3. How and what to measure – Types of data
4. A framework for developing a sell-out forecasting system
6. Advanced Forecasting – Methods for optimizing and fine tuning forecasts
1. Demand forecasting for upstream value chain players
Demand forecasting has long been a central and core activity of the sales and planning functions of most organizations. Though the activity is generally managed by the sales group, it is a critical input into most corporate functions and the starting point of the corporate budgeting and sales and operations planning (S&OP) processes.
Historically, the focus of organizations during the demand planning exercise has been on “sell-in” forecasts. This is the volume of demand for products or services a company expects to fulfil over the course of some future period. For most public corporations, this period typically constitutes a quarter or a year, in line with their financial reporting period.
Recently however, a greater number of organizations have started to look more closely at and manage their business against “sell-out” demand forecasts. The sell-out forecast is the volume of the final product that is expected to be sold to the end consumer (which typically includes several intermediate components) in some particular geography. For example, for a mobile LCD producer, a sell-in forecast would constitute the number of LCD panels it expects to sell to its customers (mobile OEMs) in the course of a fiscal quarter, while a sell-out forecast would be the number of smartphones with its LCDs the company expects will be sold to end consumer over the course of the same quarter in China. Being able to accurately measure and predict the volume of the latter, (sell-out units) across more granular customer segments yields several benefits for organizations. These include:
- More accurate production planning as a result of reduced upstream demand variability
- Better allocation of marketing dollars across geographies and product segments in order to drive demand for the highest value segments resulting in a higher marketing ROI
- The ability to set more accurate and granular sales targets for the sales force across regions and sub regions
- More dynamic and demand driven pricing capabilities resulting in reduced fire sales and improved margins
Yet, even with the widely recognized benefits associated with incorporating sell-out forecasts into corporate planning, few organizations have made concerted efforts to engage in it. The few that do attempt to forecast sell-out often use primitive methods such as consensus based estimates instead of statistically sound forecasting techniques. This is primarily due to the complexity associated with accurately modelling sell-out forecasts and the disparate data landscape underpinning their complex value chain.
This article is intended to provide a framework and practical approach for understanding when sell-out forecasting can drive value and subsequently how to conduct a sell-out forecasting exercise.
2. Industry dynamics and other factors that warrant more emphasis on sell-out forecasts
There are certain external and structural industry factors that determine the relative importance of a sell-out forecast for an organization and the subsequent value they can realize by managing their business against sell-out forecasts versus purely sell-in forecasts. The framework below is a useful guide for understanding the dynamics that dictate the importance of needing sell-out projections to run a business:
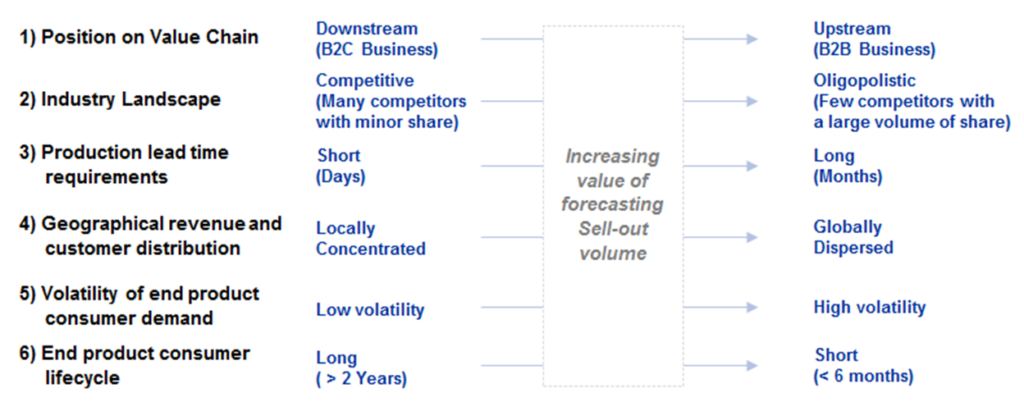
Sell-out forecasts are typically most useful to upstream value chain players that operate in an oligopolistic B2B environment where production lead times are long and the end product has a global and diversified customer base. Having a sell-out forecast is especially useful in environments where the end product consumer demand is highly volatile and where the end product lifecycle is short. Under these conditions, having downstream visibility and confident projections of end product demand for each segment can significantly aid an organization in in navigating the uncertainty it faces.
3. How and what to measure – Types of data
As previously noted, the complexity associated with the sell-out forecast modelling exercise is to a large extent driven by the attributes of the underlying data. No single data source is exhaustive in its coverage and attributes or entirely accurate in its estimates. In some instances one data source may even contradict another.
Though the specific data sources vary by industry, they can be classified into a set of categories based on the position in the value chain where the data is being collected. There are certain inherent characteristics of each of these data sources that are important to note in order to understand their relative worth and predictive value.
The figure below is an example of the sell-out data sources available to a mobile LCD maker trying to estimate historical volume and create sell-out forecasts for mobile devices that contain its LCD components
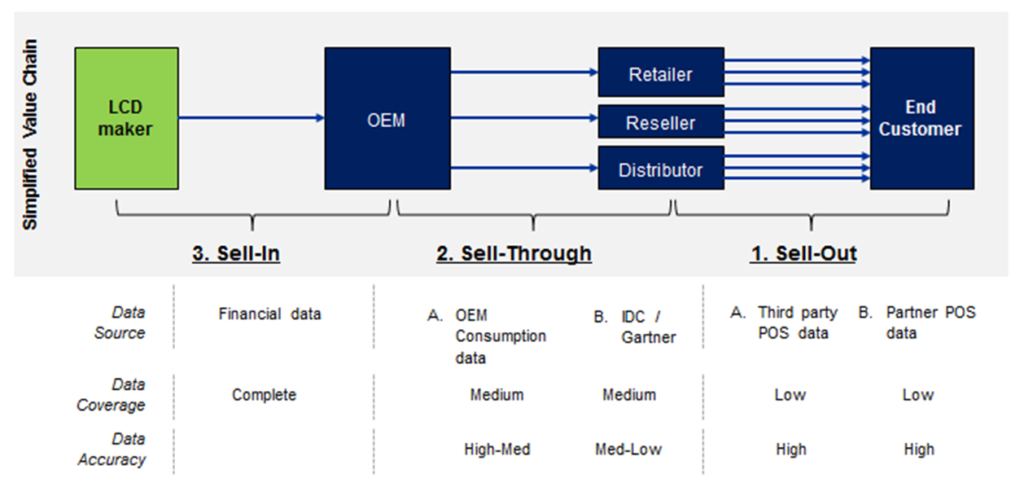
1. Sell-out data: The most accurate and reliable source of sell-out volume is point-of-sale (POS) data since it is comprised of aggregated actual sales to end consumers. However, given the vast number of transactions that comprise the overall sell-out market, no single sell-out data source will provide exhaustive coverage of the market. Sell-out POS data can be obtained primarily through two methods
- By purchasing through third party data vendors: Depending on industry and geography, different vendors specialize in aggregating such data. For example, AC Nielson and IRI have strong coverage of the North American consumer product POS market while GfK has strong POS data coverage in the European and Asian consumer electronics retail markets
- By collecting this data from retail partners: If an upstream component maker has strong relationships and provides marketing incentives to downstream retailers for promoting its products, the component maker can design their marketing campaigns to be contingent upon partner data sharing. However, given the large number of retailers and B2C enterprises in many industries and geographies, this channel for data collection is more feasible in less fragmented and more developed and structured markets.
2. Sell-Through data: Sell-through data is the estimate of product volume shipped in the intermediate step of the value chain. For a mobile LCD maker, this could be the number of smartphones with a specific LCD component that an OEM such as Samsung ships to retailers across regions. Though sell-through does not constitute actual sales to the end consumer, it is a good proxy for the sell-out that is expected to occur within a certain region. This source of data can be obtained by the LCD maker in one of two ways
- By purchasing through third party data sources: Certain vendors specialize in market sizing for different industries. For examples, Gartner and IDC have a strong presence in the consumer electronics sell-through market. These market research firms’ survey major consumer electronics OEMs (e.g. Samsung, HTC, Apple etc.) and sample demand from different geographic markets to estimate volume across regions. Since these firms typically reconcile their estimates with the component manufacturers, they are effective at accurately estimating the entire market size of a certain product category, however the accuracy of their estimates for any particular consumer or geographic segment may be more suspect which may lead to a loss in confidence in the more granular segment estimates of this data
- By collecting this data from OEM partners: If the customer sales for the LCD maker (to various OEMs) exhibit typical Pareto characteristics, where a few OEMs comprise the vast majority of sales, the LCD maker may be able to collect more granular segment data directly from its OEM partners. OEMs after all are well aware of the regions and customer segments they are supplying to. This method requires cultivating strategic partnerships with key customers since OEMs consider such data to be proprietary and a core component of their competitive advantage
3. Sell-in data: This is the internal financial and shipping data available to a company, in this case the LCD manufacturer. Though this data does not provide downstream insights regarding volume for various customer segments, it is useful for reconciling the totals across segments since the total market volume across all downstream segments can never exceed the volume of product the LCD maker itself shipped.
4. A framework for developing a sell-out forecasting system
The following steps serve as a practical guide for organizations that want to successfully undertake the development of a sell-out forecasting system:
A. Align on a level of granularity for the measurement of historical actuals and forecasts and define the segments that will be measured
The first step in attempting to measure and forecast sell-out is to agree on the metrics and the level of granularity that will be measured. The typical dimensions on which an organization may require additional granularity include product type (starting from product category all the way down to individual SKUs), geographical segments (regions down to cities and zip codes) and sales channels (such as retail or commercial distribution). It is also important to determine what metric will be measured. Though volume is the most common metric, an organization can also track and project ASP, revenue and share numbers.
The successful completion of this step results in the creation of a fixed number of end customer segments that will be measured. While these can range from a handful to several hundred, it is beneficial to begin with a fewer number of large and well defined segments.
B. Develop a replicable process to estimate historical actuals
After determining what to measure, an organization must determine how to measure it. Different functions within the same organization often use different methods of calculating critical metrics such as market share of the same consumer segments. Aligning on a single set of criteria and rules by which to measure historical actuals for each segment is the single most important and difficult aspect of sell-out forecasting. The difficulty is compounded by the challenges and gaps in the data. Therefore, the first step in creating a transparent and replicable process to measure each segment is to systematically rank and prioritize the underlying data sources.
- Use a data hierarchy matrix to prioritize the data sources: Prioritizing the data can be best accomplished by ranking each source on every critical attribute such as relevance, coverage and accuracy. A composite index across all attributes can be used to rank the data sources.
- Develop assumptions for time-shifts, inventory and other factors to account for different types of source data: Once the data hierarchy has been created, establish assumptions to ‘normalize’ data across the different sources. Since data sources vary in the position of the value chain where information is collated, this can entail estimating time shift and inventory assumptions to, for example, compare and equate sell-through data to sell-out data in the same time period. This process is crucial because it enables the metrics across data sources to be compared for the same time period. For a mobile LCD maker, this would involve making assumptions on the amount of seasonal smartphone inventory retailers carry and component inventory OEMs carry followed by estimates for OEM manufacturing lead time and shipping transit time. Once the data is normalized any high ranking single source can be substituted with another lower ranked source in areas where gaps in the data exist.
- Establish business rules to create a consistent and transparent methodology to measure historical volume: After ranking and normalizing the data sources, an organization must create an algorithm that is premised on practical business rules to apply the ranked data to measure each segment. The rules must be tiered and exhaustive such that if a high priority data source is available for a segment, the model must be instructed to use that data source to measure that segment but the model should default to some lower ranked data source if no other higher ranked data source is available. The output of this exercise will result in a measurement for every single customer segment of sell-out. Since this exercise requires mixing data sources, there must be an effort to normalize the totals across segments to ensure that they match over the long run with what the company themselves are shipping.
- Test and socialize results: Once the rules are created, they must be tested will actual historical data for several periods. The volatility in the trend for each segment across periods should provide a good sense check of the approach and output. Further, the estimates for each segment must be vetted and socialized with key stakeholders in the organization to ensure the methodology receives widespread buy in. These could include stakeholders across the business units, regional sales groups or customer account teams who tend to be familiar with their specific subsets of the business.
C. Agree on a starting sell-in forecast (Internal or External)
All organizations have internal sales (sell-in) projections. Once historical sell-out numbers are estimated, the most recent historical splits for each segment can be applied to a company’s internal sell-in projections to estimate what the equivalent sell-out will be for each segment in a future period. These can be tweaked for seasonality, inventory and other one-time adjustment factors (e.g. design wins, retired SKUs etc.) to make the projections most reasonable and accurate. Using this “top-down” forecasting approach, an organization can successfully leverage historical sell-out trends coupled with internal forward looking sales projections of its products to predict how these products with flow out to various end customer segments. This enables organizations to align their segment level resource allocations to their overarching sales strategy.
5. Measuring accuracy
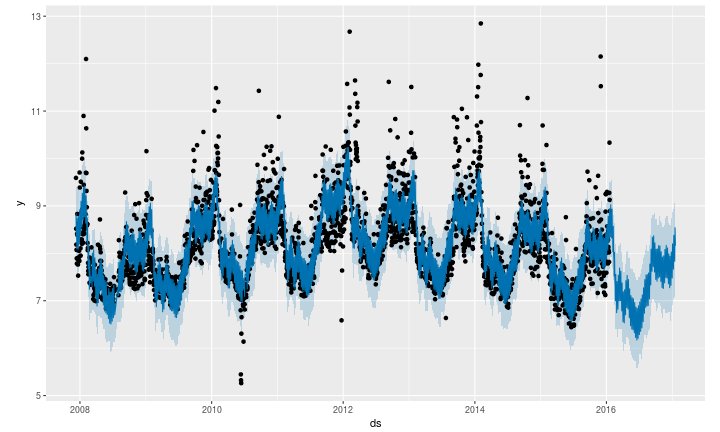
Forecasting is an inherently iterative exercise. The most effective forecasting systems are designed using an objective Bayesian approach which is based on improving forecast error by making small iterative adjustments with each new data point that becomes available. The first step in improving a forecast therefore is to measure the historical forecast for its accuracy. An objective metric for measuring forecast accuracy is the Mean Square Error (MSE) as it accounts for a relative error in the prediction versus what actually happened regardless of the direction of the error. This ensures that if actual volume for a certain segment ended up being 20% higher than the predicted value for that segment while volume was 20% lower than the predicted value for another segment, the accuracy in aggregate across those two segments does not cancel out. The simple average across these two segments will be zero but the average MSE in this instance will be 20%.
MSE can be measured at the segment level as well as an aggregate level. While certain stakeholder groups may be more concerned about the predictive accuracy of a particular customer segment, the effectiveness of the entire system should be assessed according to an aggregate MSE number which is a powerful and simple single numeric value to evaluate the predictive effectiveness of a forecasting system. Since the volume across each end customer segment will not be equal, the aggregate MSE number should be a weighted average using the volume of each segment as the MSE weight.
Forecast MSE numbers vary by industry so benchmarking average forecasting variance against industry peers is a good way for organization to measure their forecasting effectiveness. In the absence of external benchmarks, a good internal benchmark for forecasting accuracy is the relative standard deviation of the underlying business. If the forecast error is significantly lower than the volatility of the underlying business segments, then the organization is doing an effective job at forecasting.
6. Advanced Forecasting – Methods for optimizing and fine tuning forecasts
The “top-down” forecasting method described in the previous section is a good starting point for creating a sell-out forecast, though like any single variable forecasting system, it has its limitations. Organizations requiring more accuracy in their forecasts should consider more sophisticated predictive models that take into account other factors as well, such as retailer “bottom-up” forecasts, seasonality indices and macroeconomic indicators. Once these additional data points are normalized to match the structure of the initial top-down forecasts, they can each be inserted into a multi regression equation and fine-tuned such that the weights assigned to each predictive variable for each customer segment minimizes aggregate MSE in a hypothetical back cast. A composite forecasting system such as this can be designed to be a continuously self-improving system that takes the most recent data available and adjusts the coefficients for each underlying forecasting variable and the underlying regression equation to minimize overall error. External benchmarks by industry provide a good comparison for organizations to continuously evaluate their abilities to forecast sell-out volume.